Software and Related Occupations: A Longitudinal Analysis
This post accompanies a talk I gave at Hack Brooklyn in April 2026.
When I was first invited, I planned to call the talk "Software vs. Big Tech and the Future of Software Engineering." Over the last five years, I've seen both sides. Early in my career, I worked at Facebook, Apple, and JPMorgan Chase. I learned what it takes to get in and what it takes to succeed. After that, I spent three years in San Francisco working with startups. I was consulting with companies of all scales and companies backed by major VCs, had joined accelerators myself, and have been working across both hardware and software. It's an exciting environment with a lot to offer.
I have a lot of advice and observations I know a student entering the market would really value.
But there's a problem.
It's hard to tell students what the industry is like when there's a more basic, more urgent question every student is contemplating: Will we even have a job?
I know students are thinking it. I've thought the same thing. Predictions are cheap, so I'm not going to make many here. Instead, I want to ask a different set of questions. How has the software job market shifted in the last 5 years? How have wages changed? What about entry-level hiring? How much harder is it to break in today than it was before Claude and ChatGPT?
And how much of what we're seeing in the public discourse (layoff headlines, "learn a trade" memes, doomposting threads, etc) is real, versus sensational news cycles and ragebaiting content?
So I did what any curious person would do. I combed through the data and analyzed the job market. Here is what I have found.
Part 1: Unemployment Rates
The most natural place to start for this question is with unemployment rates. The Bureau of Labor Statistics publishes the Current Population Survey (CPS), which gives us unemployment rates broken down by occupation. That's exactly what we want here. I've charted a handful of occupations that I think students would actually care about. It's a Plotly.js chart, so you can zoom in, filter, and move around to make sense of the data yourself.
The first thing you'll notice is a very clear spike in unemployment around 2020. This is the first macroeconomic pattern that will continue to show up across all of the datasets we look at. This is of course the disruption from the COVID-19 global pandemic which caused mass unemployment across the board. Food service was hit especially hard, but every occupation experienced some level of disruption. You can see that reflected pretty clearly in the data.
What you'll notice pretty quickly after that is that the highest unemployment rates sit in construction, transportation, food service, and sales. Computer and Mathematical Occupations sits right after those and has seen a recent uptick in unemployment. This category includes most software engineering, data science, information technology, AI, devops, data engineering, and even areas like computer hardware, robotics, and electronics.
The observant reader may notice that the previous chart stops in 2024. We have the 2025 government shutdowns to thank for that. However, after a bit of digging, I realized that the Current Population Survey also publishes monthly unemployment rates, not just annual averages. That's what we'll look at next.
This version is more volatile. It's monthly rather than annual, so it fluctuates a lot more. But the general pattern holds: Sales, transportation, food service, and construction still sit higher than Computer and Mathematical Occupations. Computer and Mathematical Occupations tend to track closely with Life, Physical, and Social Science Occupations. Both increase going into 2025, and more recently, Life, Physical, and Social Science Occupations appear to tick down slightly, lagging behind Computer and Mathematical Occupations.
Keep in mind that when we refer to Life, Physical, and Social Science Occupations, we're talking about roles such as biological scientists, chemists, physicists, environmental scientists, economists, psychologists, and sociologists.
Our takeaway here is that going into the trades is probably not going to make employment any easier and that there has been a recent increase in unemployment for software-adjacent roles lately. Let’s dig into that.
Part 2: Hiring Rates
If unemployment rates are generally trending downwards, the next question is obvious. Are we hiring enough?
This was the exact question I had as well. Fortunately, the Bureau of Labor Statistics publishes another wonderful dataset called the Job Openings and Labor Turnover Survey, or JOLTS. JOLTS is a monthly survey of employers that tracks job openings, hires, layoffs, discharges, quits, and other separations. In other words, it gives us a view into labor demand and turnover. It shows how many employers are actively trying to fill a role, how many people they actually hired over the course of the month, and how many workers left their employer.
You'll notice our second major macroeconomic pattern here. The noticeable rise in job openings and quitting right after the separation from the global pandemic. This is a product of our ZIRP environment. During and immediately after the pandemic, we were in a zero interest rate policy environment. Capital was cheap, and in some cases close to free. This meant businesses had easier access to liquidity and were more willing to take risks and hiring increased significantly. This not only meant more hiring and more open positions, but that people were job hopping. You can see that volatility reflected in the data: more job openings, more quitting, lower layoffs, and more hiring.
After that, you may next notice that job openings, hires, quits, and layoffs are similar and slightly below their 2018 pre-pandemic levels. Population continues to grow, of course, so it’s concerning to see that the series currently seems flat to downward. We see a pretty noticeable dip for hires and job openings in the most recent two data points. That is a bit alarming and a sign of a troubled job market.
Our takeaway here is that the current job market is difficult compared to before COVID-19. Simply put, it’s tough to get a job right now.
This is the overall labor market, not specific to Computer and Mathematical Occupations. So our next question is also obvious: Do we have something more targeted?
Part 3.1: QWI Hiring Rates, Software vs. Everyone Else.
To answer that, I turned to the Quarterly Workforce Indicators (QWI) from the U.S. Census Bureau. This dataset lets us get a lot more specific by focusing on industry level health markers such as employment, turnover, hiring, and wages. It has similar data to JOLTS, but is broken down by industry and worker characteristics. This gives us similar information but with higher granularity. For this analysis, I focus on NAICS 5415, Computer Systems Design and Related Services industry. I use that as a proxy for the software industry for the rest of this analysis.
So let's look at hiring again, but this time comparing the software sector to the rest of the market.
Of course the pandemic shock and the ZIRP inflated hiring still shows in our data. What do you notice after that? Probably the hiring rates are low for everyone compared to the pre-pandemic levels. For both all industries series and the software proxy series, we are visualizing a decline in hiring rates. It seems that decline from 2022 ZIRP environment is more pronounced in the software sector. Truthfully, that is consistent with my own anecdotal experience of watching tech aggressively overhire post-pandemic and then having to conduct layoffs.
You might also notice that the gap between those two lines widens through 2023 and 2024 briefly. That period overlaps with the release of ChatGPT in November 2022 and Claude in 2023. This may be related, though it's difficult to draw any causal conclusions from correlation alone.
In the most recent data points from 2024 to end of 2025, for two years, the gap between the software sector and the rest of the market sits at around three percentage points, with software lower than all industries. That may seem alarming at first, but in context, this seems to be the historical pattern looking back through 2012 to 2018. I’m eager to have more data from Q1 of 2026 to see if this 3% gap continues hold up.
That may seem confusing but the takeaway is simple enough. It seems we have stabilized but hiring is low for everyone. We are seeing less pandemic job loss and less ZIRP enthusiastic hiring, but hiring is down compared to the pre-pandemic levels. It’s a difficult time for job seekers right now across all industries and it is not especially difficult for software engineers.
Part 3.2: QWI Hiring Rates by Age Groups.
The next question that arose for me is: is it harder to hire for new grads specifically? I would have expected so, but the data was more promising.
For ages 22–24, the hiring rate is closer to 18%, and software is actually overtaking the average of all industries. The previous line chart fluctuated between 10% and 20%, but for the 22–24 cohort, we see 14% to 30%. That's genuinely surprising. I suspect we have the culture of internships to thank for that. A lot of college students spend summers interning and have an offer lined up upon graduation. That said, the current hiring rate for new grads is still lower than what we saw pre-pandemic, and you'll notice that new-grad hiring rates swing much more within a single year.
Overall, I think this should be encouraging to the average student, but let me know what you think about it!
Part 3.3: Earnings for New Hires
The next question that came to me is: are we getting paid less thanks to the AI revolution?
The QWI publishes monthly wages for new hires broken down by age and industry. This is what I used here. The "new hire" definition here is a bit more specific than it sounds. In QWI terms, this refers to workers who started in the prior quarter and remained employed long enough to become stable full-quarter employees. This filters out very short-term hires yet maintains the pulse on new offers for the industry. One thing to keep in mind is that this includes both part-time and full-time workers, so it's not a pure full-time salary measure.
Here's a chart from QWI showing how much a new hire between 22 and 24 years of age is taking home on a monthly basis.
From 2012 to 2025, the overall pattern is straightforward. Earnings trend upward. This is perhaps the third macroeconomic pattern you may have noticed in the last two charts. There is a regular cycle in wages and hiring. Quarter-to-quarter, these fluctuations are consistent and are most likely attributed to seasonal hires and compensation cycles and bonuses toward the end of the year.
But the broader takeaway is clear, yet again. Earnings for new hires between the ages of 22 and 24 in this software sector have increased over time.
Here's another graph I want you to consider.
I've added another set of data points here. The green line shows earnings for ages 25 to 34 in the software sector. Roughly speaking, this is what those 22-year-olds can expect to make in just a couple more years in the same industry. I think that's quite impressive and motivating for any new grad looking at the job market right now.
But here's a more staggering comparison.
This is what the average worker outside of the software sector is making at ages 22 to 24. The difference is large. We're looking at roughly $2.7K versus $5.7K per month. That's a meaningful gap at the very start of a career. And I just want to emphasize that this is likely your starting salary as a software engineer.
And if that seems surprising, consider one more data visualization. This will be our last chart.
A new grad in the software sector is, on average, earning at or above the national average for workers in several older age brackets including workers in the 35 to 44 range. It is very common for a 22 year old in software to be making more than a 40 year old with a lot more experience and often more financial responsibilities. The 22 year old software engineer will only continue to increase their wages rapidly, whereas the 44 year old may be near the ceiling of their pay, though I admit that is conjecture on my behalf. Take a moment to think about that very clearly when deciding to leave the software job market.
Part 4: Putting It All Together
I know that was a lot, so let's summarize everything.
First, we saw that unemployment in Computer and Mathematical Occupations has ticked up, but it still sits well below construction, transportation, food service, and sales. It tracks closely with Life, Physical, and Social Science Occupations that include hard science occupations. Though hiring may be hard for computer related roles, it’s still not the highest and construction and trades may have a much harder time finding jobs.
Hiring in the broader labor market is at or below pre-pandemic levels for everyone. This is a hard job market for anyone trying to get hired right now, not just software engineers. The job market is low compared to the pre-pandemic levels of hiring and the job market cannot compete with the post-pandemic zero interest rate policy environment we saw up to 2023 or 2024.
It seems that the immediate disruption we saw from the global pandemic caused an increase in layoffs and a decrease in quitting, job openings, and hiring. I’m sure that is not a surprise to any of you. Post- pandemic, there was a massive swing in the other way with pretty noticeable increase in hiring and job openings and quitting. Employers were hiring and paying more, employees were quitting and accepting new offers. We now see that the hiring rates seem to be at a consistent 3 percentage point gap now for two years, similar to pre-pandemic levels. Though the hiring rate seems stable, it is low.
Surprisingly, we see that the new-grad hiring rate in the software industry is actually much higher than the rest of the market, likely helped by the internship-to-offer pipeline. Furthermore, hiring rates for 22 to 24 year olds in the software sector are higher than the same age bracket for all industries. Meaning, entry-level software has a higher hiring rate than its non-software counterpart.
And lastly, the pay is still very high and is trending upwards. Entry level compensation rivals mid and late career pay in other sectors. The pay in just a few more years at the next age bracket (25-34) is almost double the already high monthly pay they started with. Though the 22 year old in software may make more than the average 40 year old in the population, the 25 year old in software makes even more. I think that’s pretty jarring to see.
Overall, the job market is tough for everyone right now but software is still some of the best pay you can get and counterintuitively new grads have a much higher hiring rate than the average. Hiring has stabilized since pandemic but remains low.
Part 5: Thinking Beyond the Data
The data tells us what has already happened, but it's a lagging indicator by design. So any conversation about the software industry and the job sector has to discuss AI and the future of the occupation. We are now leaving the realm of what I have measured and getting into conjecture and personal views.
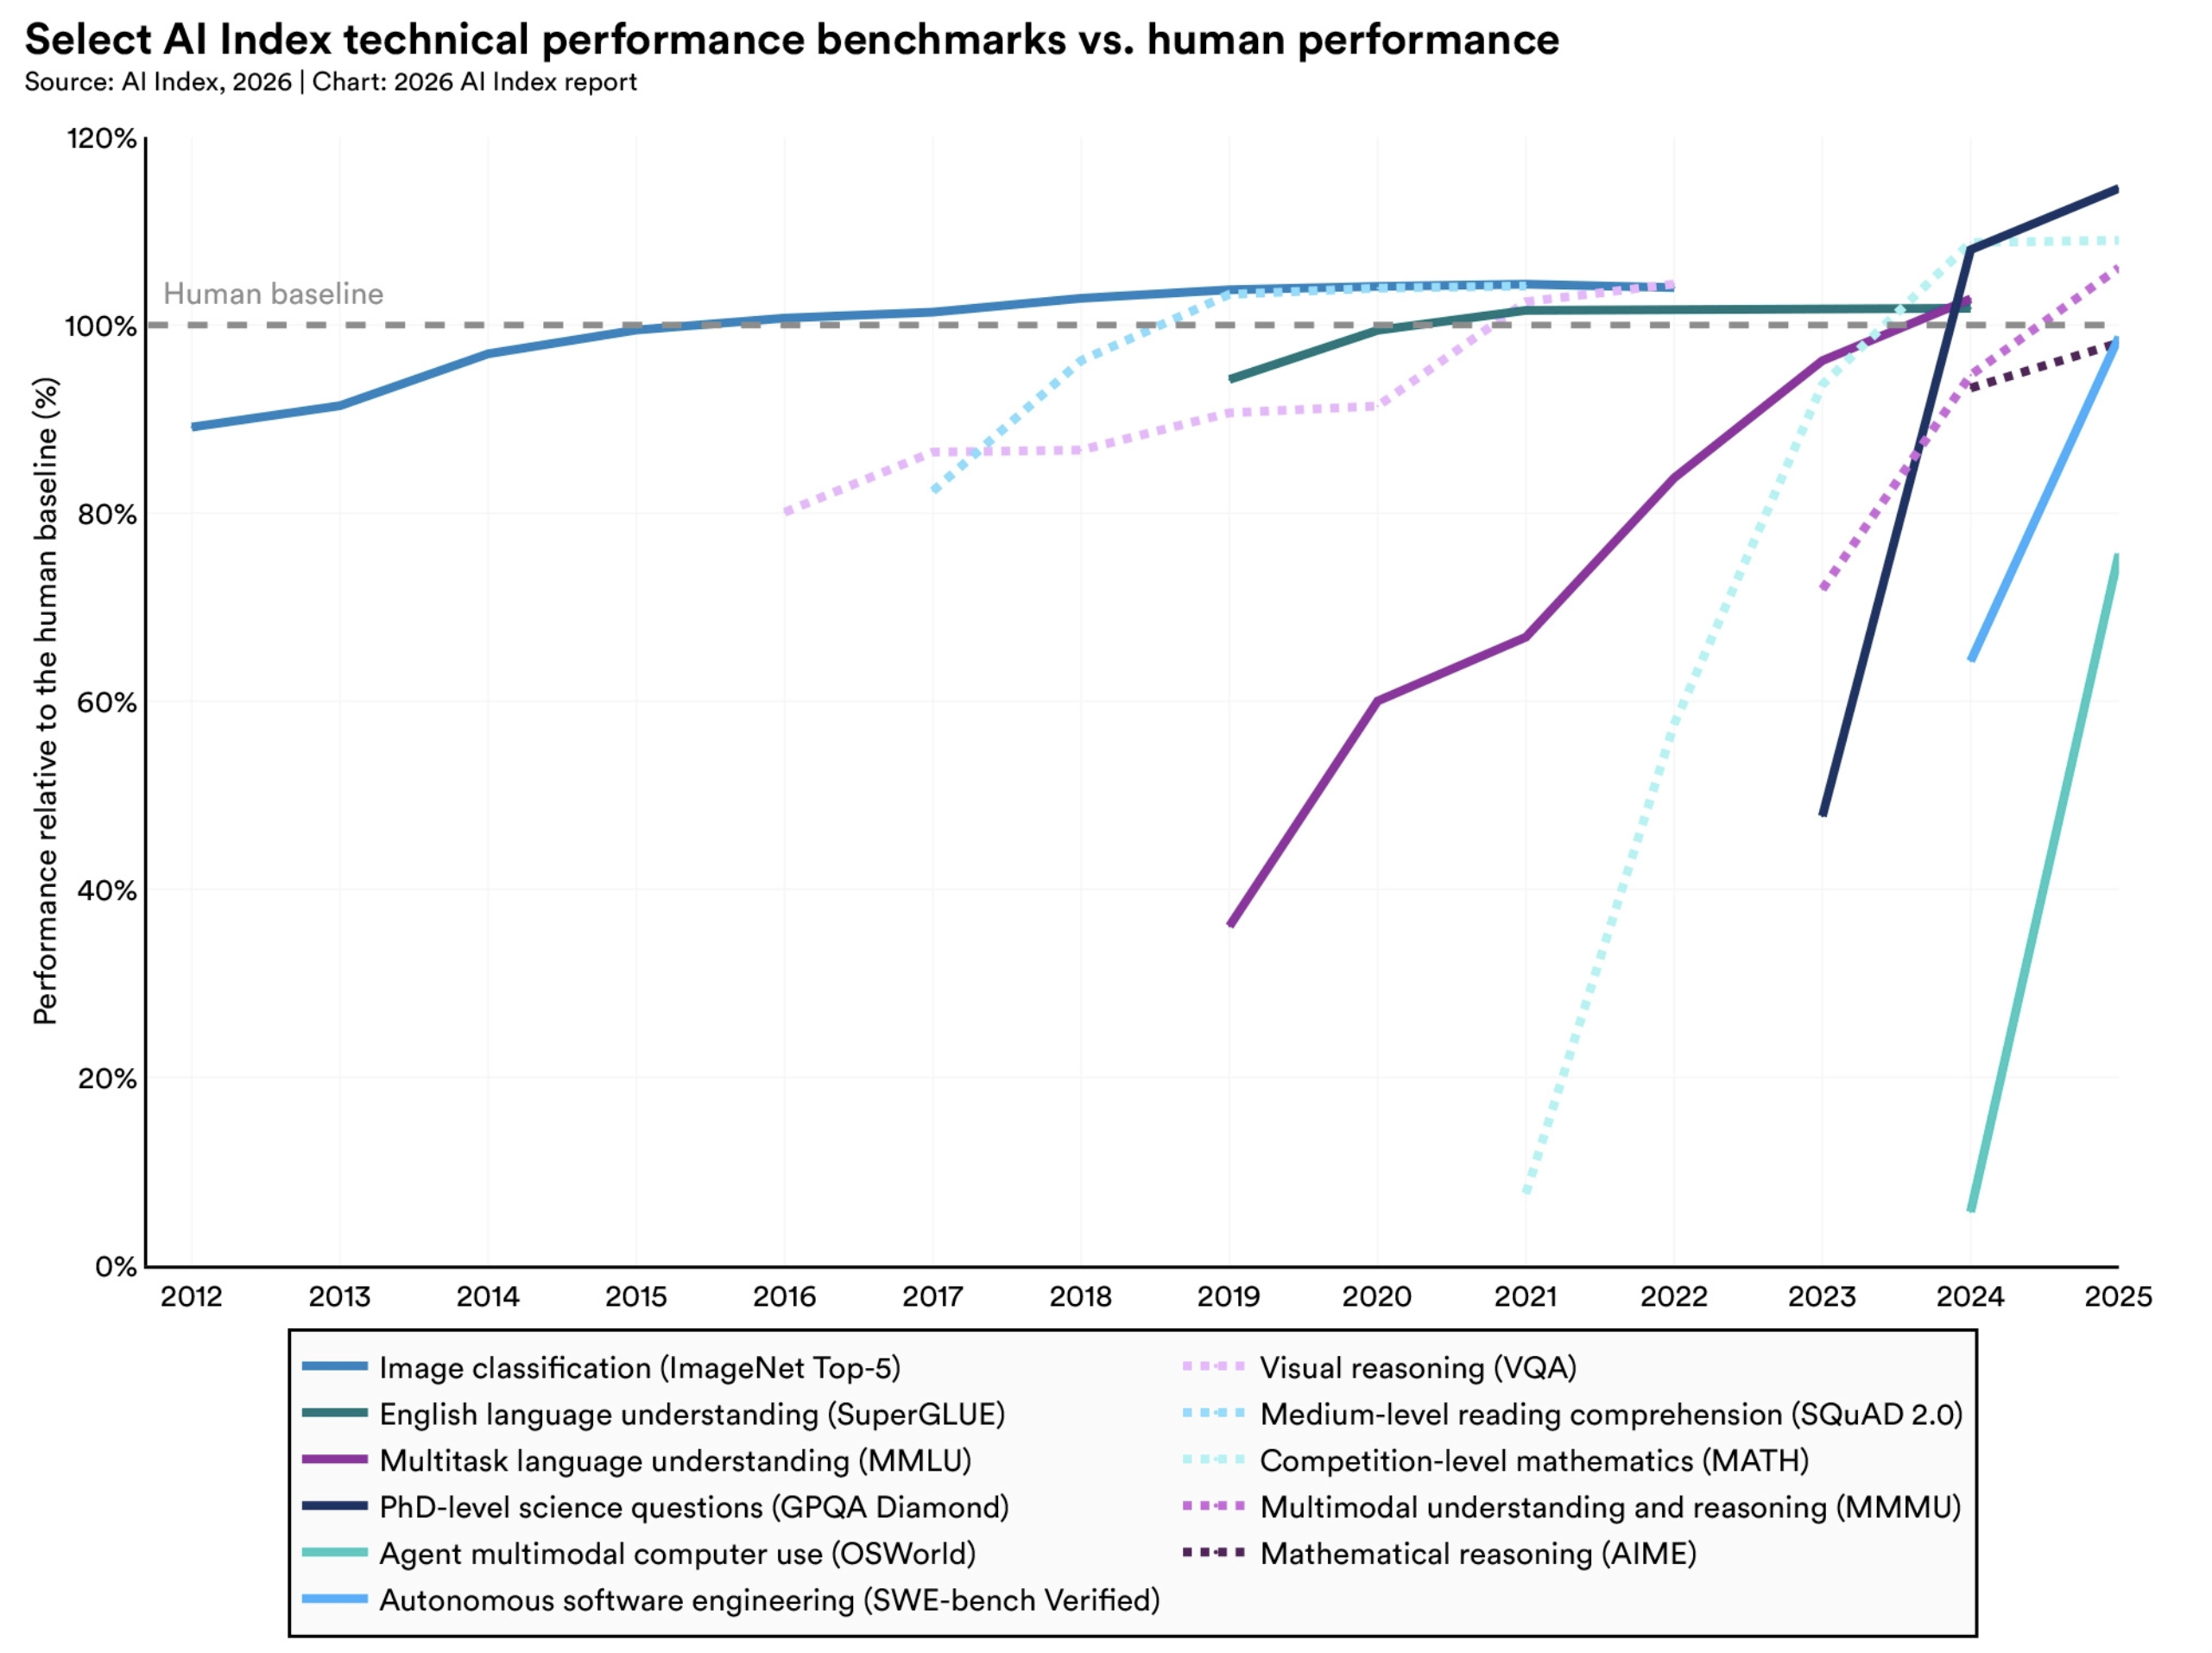
The models are capable, and they're capable across more than just programming. Benchmark results across coding, math, medicine, image analysis, and reasoning have all moved substantially over the last few years. The leading AI systems have made novel contributions in medicine and math.
Though the models are very capable beyond just computers, software engineering is uniquely at risk, not because of the nature of the job. Nearly everything we do is on the computer and AI can integrate with that a lot easier than many other roles.
However, we are not there yet. Currently, software engineers are using LLMs as companions who can write the code while they’re defining systems, explaining architecture, making tradeoffs, debugging in real time, contextualizing the massive infrastructure their organization has and working with partners like designers and third party vendors. Similar to how compilers enabled us to write in high level programming languages, the coding agents are enabling us to describe our architecture and even coding structure while they write the code themselves, sparing us from syntax, API documentation, and the inner workings of a random library we need.
It’s not inconceivable to me that the software role does not exist in 5 years. Currently, any product manager or technical CEO can build relatively sophisticated products from just an idea in about a day. Though that is not a sophisticated production environment, that is still very impressive. Truthfully, we don’t fully understand how good these models can get yet. We don’t know how much more effective they’d be with sophisticated harnesses, tooling capabilities, and sandbox environments to test. We’re at the very beginning of this right now.
I say all of this because I do not want the readers to walk away with a false sense of confidence and safety. Truthfully, the data from the labor markets were more positive than I was anticipating. It does not seem to me yet that AI has completely shattered the software occupation. This is a tough market across the board but software is still some of the best jobs you can get and you will not have a better opportunity by converting to the trades.
Software has defined the last 20 years of our reality. It seems to be even more true with the current AI boom. People who are knowledgeable about computer systems and curious about the future will be welcomed with open arms. It's hard to know exactly what will happen and what jobs will remain in the future, but what I can tell you is that this will change the world, and I hope you will take on that challenge to shape it with us.
I am tempted to give advice, but I will spare you and end the piece here. I hope this data and this perspective will serve as a launchpad for your own investigations and questions. Whatever you decide, decide it with your eyes open.
Best of luck,
zoda
P.S. This piece started as a talk at Hack Brooklyn. Want me to write or speak for you? Let’s talk →